
The driving force of your company is your sales team. This is the team that has an extensive range of operations to focus on and manage in a fast-paced ecosystem. Examining sales analytics in the form of sales metrics helps optimize sales activities, improve accountability, and increase team’s performance.
To know more about sales metrics like key performance indicators and more, continue reading this blog.
Table of Content
What are Sales Metrics?
Sales metrics are the crucial key performance indicators (KPIs) that empower sales team and organization to evaluate performance against the set objectives, observe progress, and make essential adjustments for prolonged sales success.
Finding the key metrics for your company and team depends on KPIs that you classify as crucial to the business model, such as sales processes, and sales cycles. The right metrics can aid an organization make wise decisions for any modifications needed to accomplish both short-term and long-term goals.
The Key Sales Metrics to Track
Here are the crucial sales metrics that aid you make vital decisions about your sales process. This, in turn, keeps your pipeline full and grows your business.
-
Average Revenue Per User

The average revenue per user (ARPU) refers to the amount of money that a business receives in revenue per customer in a particular time period.
When To Use
This KPI can be used when your average revenues seem to be increasing. A high value of this metric indicates that your company is holding weight, and providing discounts to attract customers may not be necessary. Additionally, this metric can be used to identify your target audience and its market niche.
How To Track
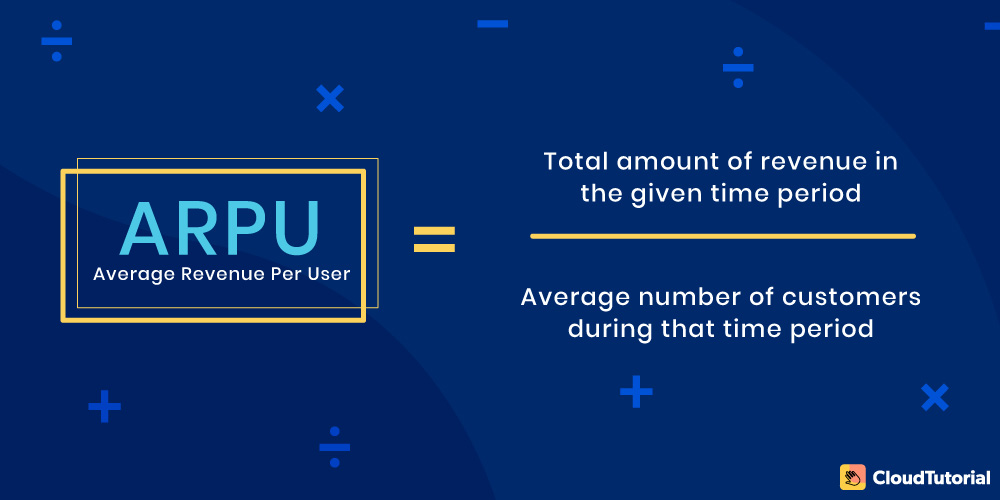
The average revenue per user (ARPU) is calculated by dividing the total amount of income for that period by the number of customers or during that period:
ARPU = (total amount of revenue in the given time period) / (average number of customers during that time period)
-
Annual Recurring Revenue
Annual recurring revenue, or ARR, is the total amount of contracted revenue that your company brings each year. It is particularly critical for businesses that provide a subscription-based contract of their product.
Existing and new customers will return only if they are convinced of the product. CloudTutorial provides your business with a platform to build the foundation blocks for unparalleled customer service and support. A fully customizable platform allows businesses to create help desk, FAQ pages, and standard operating procedures to enable solution sharing.
When To Use
ARR can be used to forecast a company’s growth in the long-term. Therefore, it is a great metric to consider during times of mergers and takeovers.
How To Track
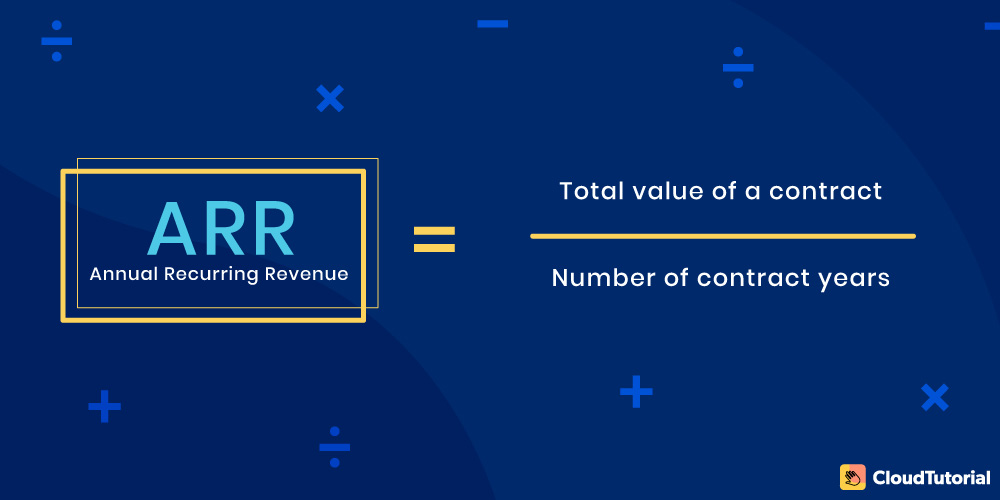
It is calculated using the following formula:
Annual recurring revenue (ARR) = (total value of a contract) / (number of contract years)
For example, a 3-year subscription of your product that amounts to $30,000 can be calculated as $30,000/3 = $10,000. This metric also helps to understand the number of customers who are currently subscribed to your product.
-
Quota Attainment
Quota attainment can be defined as the ratio of the deals or revenues converted by an employee to their total targets. This sales metric can be calculated over a month, quarter, or year depending on the degree of insights required.
When To Use
In case your business is not able to meet the required sales year on year, it is a good idea to look into quota attainment. You can identify whether or not employees can meet their goals and if not, you can intervene.
For example, this metric may highlight the need to implement structural changes in your field team if, time upon time, they cannot meet the required goals.
How To Track
This metric can be calculated as follows:
Quota attainment = (number of closed deals or revenue in given time period) / (quota for that time period)
-
Win Rate
Everybody likes to win in the business, right? Win Rate metric refers to the percentage of deals that are made within a specific time period.
When To Use
By understanding this metric, you can gain further insights into which sales team struggles to meet their goals. By segregating win rates by product, group, marketing campaigns, or any other external factor that the business had introduced, you can pin-point out exactly where your sales reps lack the finishing touch.
Once identified, you can even coach your sales rep and sales team and help your sales bounce back.
How To Track
This sales metric can be calculated as the following:
Win rate = total no. of converted opportunities/total no. of opportunities (both won and lost)
-
Conversion Rate
Another sales metric is the Conversion Rate which allows you to gauge how effectively you act on qualified leads. Potential customers are brought in by the marketing team, whereas the conversion of these leads is the sales team’s responsibility.
Monitoring conversion rates over time, and the characteristics of those leads, ensures that your company focuses on selling to relevant buyers. This translates into:
- Refined sales opportunities
- Improved performance metrics
- Efficient sales processes and sales productivity metrics
- Boosted sales growth
When To Use
If your business comprises long sales cycles, then this metric should be looked into. By monitoring it during each sales funnel stage, you can tighten your revenue machinery.
If the metric indicates a low percentage of conversion of qualified leads, you may need to consider restructuring your top sales funnel and focusing on transforming these leads.
How To Track
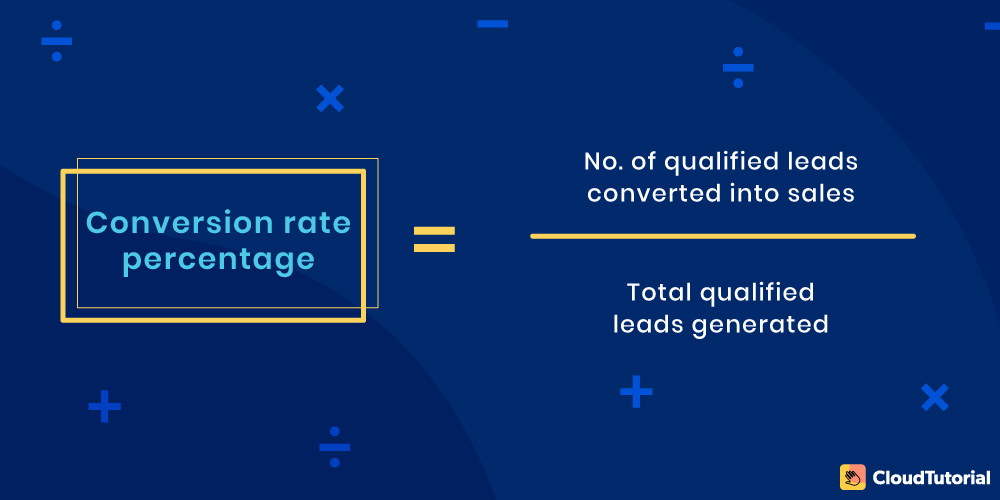
The conversion rate sales metric can be calculated as follows:
Conversion rate percentage = (No. of qualified leads converted into sales/total qualified leads generated)
Want to Record and Monitor Sales Performance Metrics?
With CloudTutorial’s KB you can register and monitor sales and gain valuable insights of business productivity!
-
Customer Acquisition Cost (CAC)
This sales metric is beneficial for growing businesses as it allows you to understand the costs associated with trying to establish or expand your customer base.
When To Use
When you are a growing business, it is so critical to be cost-effective to maximize profitability. This sales metric allows you to create a budget and allocate funds to establish your customer base.
As a rule of thumb, try to minimize this sales metric to increase profit margins. CloudTutorial enables businesses to do just that. Team members with specific responsibilities can be added to the platform to manage FAQs and other customer-related queries and update them on time.
How To Track
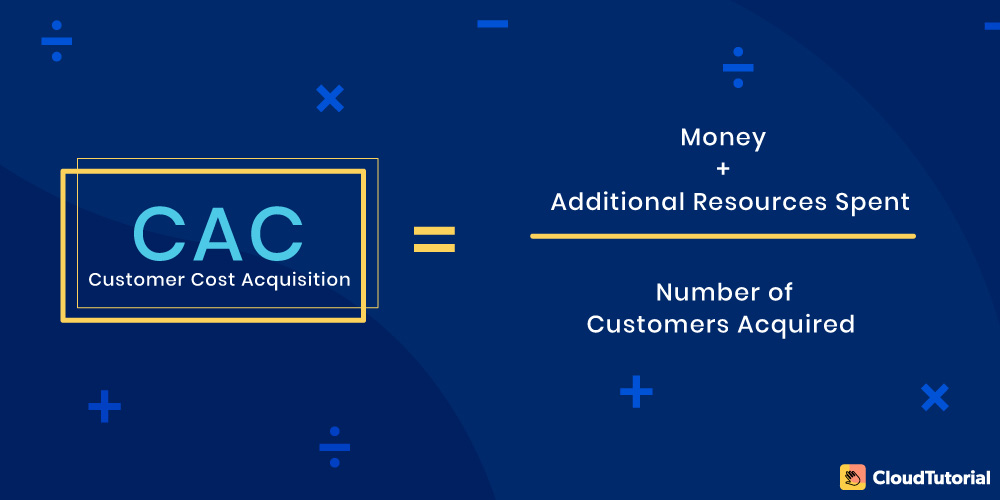
The following formula can calculate this sales metric:
Customer Cost Acquisition (CAC)= (Money + Additional Resources Spent) / Number of Customers Acquired
-
Sales Cycle Length
Sales Cycle Length indicates the amount of time it takes your business to act on a lead and see its completion.
When To Use
This sales metric helps to identify any possible sources of bottlenecks in the sales process. These delays need to be addressed as they may potentially cause your business to lose potential customers, thereby decreasing profitability. Additionally, by effectively streamlining your sales funnel, you establish higher conversion rates and generate more revenues.
How To Track
This metric can be tracked simply by using this simple formula:
Sales Cycle Length= Amount Of Time Taken (No recurring orders) / Total No. Of Individual Customers Catered
-
Average Deal Size
As the name suggests, average deal size refers to the average selling price of orders with the total number of orders. Sometimes, small orders may not be profitable for businesses in the long run as higher cost prices reduce the profitability margins.
When To Use
Average deal size helps you understand two things – Does your product have the ability to land large deals? Is your product a sticky product that requires the customer to indulge in additional sales? Are your marketing efforts resonating with the customers that have hefty budgets?
Additionally, this metric helps to identify whether or not small sales are profitable. If not, the focus can be shifted entirely towards trying to land larger orders that are profitable to execute
How To Track
The following formula can calculate Average Deal Size metric:
Average selling price = (Total amount of deals over a specific time period) / (Total no. of sales)
-
Average Profit Margin
Perhaps the most critical aspect for your business, the average profit margin, will help you predict whether or not your business will remain afloat. The average profit margin is calculated by dividing your company’s net income by the total number of sales made.
When To Use
This metric can be segregated based on product and region to gain further insight into how profitable each segment of your business is. If you identify a segment that does not yield profitable margins, you have to decide whether you want to dissolve the segment or allocate additional resources to strengthen it.
How To Track
The following formula can calculate Average Profit Margin:
Average profit margin = Net income / Net sales made
-
Deal Slippage
Businesses often tend to take more orders than they can handle. Deal slippage is a sales metric that monitors this insight/sales data – businesses’ inability to execute orders timely, leading to a delay.
When To Use
Contrary to misconceptions, slippages aren’t necessarily bad. A high value of this metric indicates that your product is in high demand. Another interpretation of the same sales analytics can be that you need to increase your production capacity to meet the increased market demand.
Pro tip:
Efficient customer support is a way by which you can reduce your deal slippage as more resources can be allocated to the order’s execution.How To Track
Essentially, this metric can be monitored by the following formula:
Deal Slippage= No. of deals that are delayed
-
Churn Rate
Churn rate helps to identify those customers that either drop out as your customer. If you provide a SaaS, the number of customers who don’t renew their subscriptions is also considered dropouts.
When To Use
This is a critical metric if you are a SaaS business that provides a subscription model. It helps you understand your customer base and whether they react positively to a new feature you launch.
Efficient customer service is a great way to reduce this metric. With the help of CloudTutorial, you can customize your website and create easy-to-locate virtual helpdesks, FAQ pages, and other tools that allow for data sharing between you and your users.
How To Track
This sales metric can be calculated by:
Churn rate = Number of churned customers / Total number of customers
-
Net Retention Percentage
Loyal customers are hard to come by, and when they do, businesses must make sure that they stick around. Net retention is a metric expressed in terms of a percentage that indicates how many customers contribute to recurring sales.
When To Use
Since this metric is dynamic, you will have to ensure that you collect data for this metric in real-time. This should be used by businesses that are trying to establish a customer base.
How To Track
A simple way to measure this metric is:
Net retention percentage = No. of customers involved in recurring sales/ Total customer base
-
Sales Linearity
Consistent sales lead to steady cash flows and profit margins for businesses. This metric helps to monitor the constant nature with which sales are distributed through a period.
When To Use
This metric can be used to monitor the whole business by segregating it into segments. This allows you to gain insights into why specific segments are outperforming others, and there is a need for restructuring to boost the sales in segments that have a low value of this metric.
How To Track
Sales linearity can be measured as the number of recurring sales (subscriptions) made during a specific time period.


Wish to Have Unparalleled Customer Service?
CloudTutorial provides you easy-to-use KB platform that can reduce your customer support tickets by 80%!
Sales Pipeline Metrics
It is inevitable for sales managers to understand the health of your sales pipeline. Several sales metrics can reveal the strength of one’s pipeline.
Sales pipeline metrics include open opportunities by month or quarter, team or individual, value of the pipeline by month or quarter, team or individual, length of the sales cycle, average contract value (ACV), conversion rate, and win rate.
For example, Net Promoter Score (NPS) might appear like a customer satisfaction metric, but it can influence your sales pipeline. If your current customers are endorsing your brand to their network, you can expect organic pipeline expansion and startling revenue.
Sales Activity Metrics
Sales activity metrics depict the tasks your sales representatives are doing daily. It can disclose strengths and weaknesses that may impact a sales rep’s performance.
The metrics that sales leaders must track are emails, sales presentations, social media engagement, referral requests, calls, proposals, to name a few. By examining the results of these activities, you can ascertain which are most effective and disperse these lessons with the whole team.
Sales Productivity Metrics
Sales productivity is the speed at which your sales representatives attain their goal. This productivity will be higher if sales reps meet the targets in a shorter span of time. Determining which inputs make the most output must be the aim of calculating these metrics.
Sales productivity metrics consist of a percentage of time in content creation, percentage of high-quality lead follow-up, percentage of time on data entry, number of sales tools used, and percentage of marketing collateral for use by sales representatives
Lead Generation Sales Metrics
A sales organization needs to assess lead generation performance and monitor leads continuously as they flow across the sales process. Having a strong grasp on lead gen can show how well your marketing and sales team is functioning.
Lead generation sales metrics include lead response time, percentage of lead follow-up within a given time frame, qualified leads, dropped leads, and customer acquisition cost (CAC).
- Total revenue
- Product or product line revenue
- Market penetration
- Percentage of revenue from new customers
- Percentage of revenue from existing customers
- Year-over-year growth
- Lifetime value (LTV) of a customer
- Net promoter score (NPS)
- Percentage of sales representatives reaching 100 percent of the sales target
- Revenue by territory
- Revenue by market
- Sales costs vs. percentage of revenue
Some of the examples of sales metrics are Market Penetration, Net Promoter Score, Lifetime Value (LTV) of a Customer, Year-Over-Year Growth, Market Penetration, and Win Rate.
The four types of metrics are Measurement, Cumulative, Binary, and Rating. Each one has its own specific setup and delivers a set of outcomes that are worth tracking.
- Sales Productivity- How much time do your employees spend selling?
- Lead Response Time- Time is taken up to follow up on potential leads.
- Opportunity Win Rate- Number of orders converted from total orders
- Average Deal Size- Values of orders that customers are placing
Conclusion
These most important sales metrics help narrow down inefficiencies in the entire sales funnel and address them at their source. Sales analytics also helps you monitor monthly recurring revenue (MRR), lead conversion rate, sales pipeline coverage, activity sales metrics, and a number of deals.
Tracking and documenting these metrics with CloudTutorial’s knowledge base platform will identify potential problems quickly and allow your sales reps to improve and succeed. In case, if you still have confusion like whether CloudTutorial is the best option for you to opt for or not then you can take a FREE trial and know how it helps your business.
Try it out before you decide.
Create a test article NOW!


Using this tool, all you have to do is add your first test article and see how it looks. Now, you don’t have to sign-up or login into CloudTutorial software just to check how your first article appears.