47% of users have reported an increase in customer retention due to CRM. Customer reporting is the key feature behind this statistic. In addition to customer retention, CRM reports help identify and sell products with accuracy by focusing on customer behaviour.
The Harvard business review has indicated many problems that come with bad CRM reports. For example, sales reps not sharing the bad news, poor tracking of outcomes versus predictions, and incomplete information.
In this blog, we will be covering many important topics related to CRM reporting in detail.
Table of Content
What is CRM? Why is it Important?
CRM stands for customer relationship management. It refers to techniques, strategies, technologies, and tools for acquiring and retaining customers.
Here is how it helps a business:
- The data provided by a CRM report helps a company make strategic decisions.
- A team can track its performance and make changes where it is necessary.
- CRM reporting provides a complete picture of what is happening in the company.
CRM reporting is beneficial for everyone working in the company, such as sales reps, stakeholders, managers, investors, or executives. Everyone uses it.
- A manager can use CRM reporting to track the performance of the team. They can send the collected data to upper management and make necessary changes.
- Sales reps can decide where to put more effort with the help of CRM.
- CRM reporting can help an executive decide whether a specific strategy is working or not in the business.
- A CRM report can show the investors how their investment is performing. It can also help them determine whether the acquisition is possible or not.
- CRM reporting has all the customer data that gets required for making informed decisions in a business.
CRM dashboards are where every data gets compiled together. A business can customize these dashboards to show the real-time summary of reports related to any roles. A CRM dashboard can show a specific sales report, purchasing behavior of customers. It can also show the overall sales process.
CRM Dashboards let decision-makers see the essential information without wasting time on one-off reports.
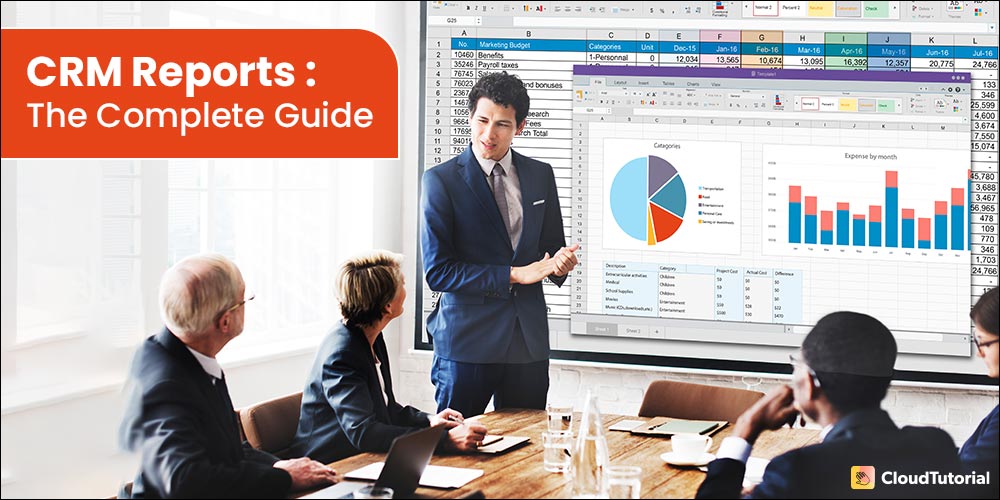
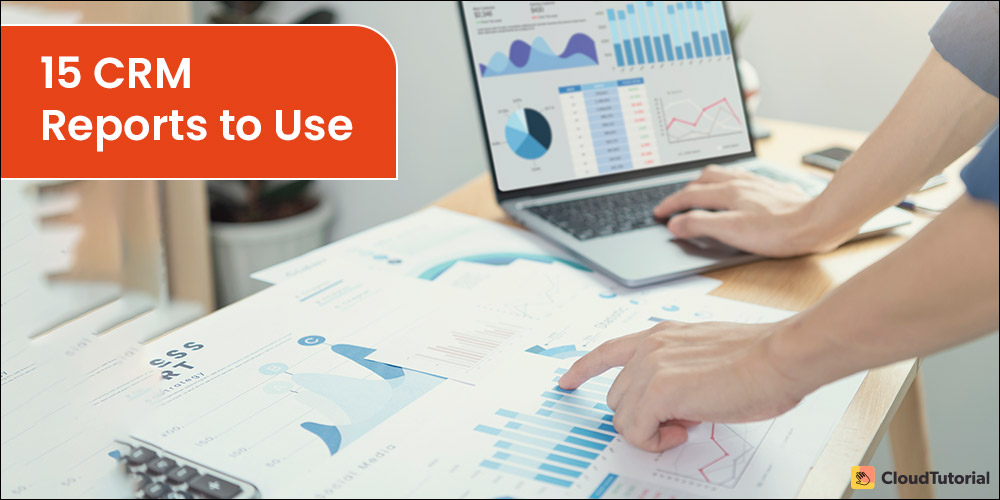
15 CRM Reports You Need to Use
-
Total Booked Revenue
The metrics here are the revenue generated by the company during a predefined period. It could be quarter-to-date or year-to-date.
Why use it: The total revenue generated by a company is an indicator of its overall success. Tracking revenue helps businesses in:
- making future predictions;
- ordering materials;
- preparing budgets; and
- making employment-related decisions.
-
Revenue Performance by Team Member
The metrics here are the revenue generated by sales reps over a period.
Why use it: The sales team is a company’s greatest asset. Although, just like with any other department, not everyone in your sales team will have the same performance. Hence, analyzing the revenue generated at the individual level will help you identify who is performing well or not.
-
Pipeline by Team Member
The metrics here are the number of opportunities that got converted into sales by the team. A sales funnel CRM report is an example of a CRM pipeline report.
Why use it: Sales performance is an essential KPI (Key performance indicator). Pipeline converts into sales. Hence, the more pipeline a sales rep brings, the more opportunities they will close.
-
Win Rates
The number of converted sales divided by the total number of all opportunities. These are the metrics that get used.
Why use it: A Sales rep is competitive and likes to achieve bonuses. The win rate data helps them stay one step ahead of their pipeline. In case a company converts 50% of opportunities into sales. A sales rep needs to have twice no of deals lined up to hit their goals.
-
Won & Lost Opportunities and its Reasons
The metrics here are all the opportunities that were converted into sales or got lost. It also includes the reasons behind its success or failure.
Why use it: Understanding customer’s motivation is essential for learning about the buyer’s journey. Why a customer chose or didn’t choose a company’s products will help provide insights into buyer behavior.
Sales and marketing can use this data to provide innovative solutions that will resonate with their customers.
-
Lead Volume by Source
The key metrics here are the leads converted during a specific period. It can be from different sources.
Why use it: A digital marketer always tries to increase the lead flow. Pay-per-click ads, social media, and content marketing often get used in generating leads.
But, a particular lead source may generate more leads than others. Hence, source-specific lead reports from CRM are essential for digital marketers.
-
Lead Quality by Source
The key metrics here are the leads converted into opportunities. They also get identified based on the source and lead ratings.
Why use it: Generating low-quality leads can be counterproductive for businesses. It can also create friction between sales and marketing teams. Hence, reports from CRM will help deliver better quality leads.
-
Contact Volume
The key metrics here are the number of contacts created during a period.
Why use it: CRM stands for customer relationship management. The relationship part plays an essential role for a business as it involves many people. Hence, contact volume is an early indicator for revenue and pipeline.
-
Sales Territory Maps
The metrics here are the custom reports, conversion reports, progress reports, sales forecasts, and campaign performance. It also includes the number of customers, leads, sales reporting, sales activity reports from any geographic region.
Why use it: Sales territory mapping enables a business to monitor sales teams across different regions. It helps them identify which areas have the most activity, determine new opportunities and allocate resources accordingly.
-
Goal Progress Reports
A Goal Progress report shows how marketing campaigns are performing against their goals. Each department will have different objectives. Goal progress reports act as a reference point for campaign reporting. It helps a business in decision-making and to keep everyone on the same page.
Why to use it: CRM makes business intelligence accessible to businesses of every size. They are easy to use and interpret. It also saves more costs as companies won’t have to spend resources on a data analytics platform and on a team to make informed decisions.
-
Sales Cycle Reports
Marketing and sales teams manage the buying process over different channels and touchpoints. It is essential to understand how various variables affect the average sales cycle. Sales cycles have become more complicated and longer, and the average duration has increased by 22 percent.
Why use it: Sales cycle reports can show the average duration across various lead sources. It can also show smaller metrics such as average response time.
-
Profitability Reports
A Profitability report shows where a business is generating money. It focuses on customers and looks at their purchasing history and buying habits. It helps determine which customers:
- Are the most loyal
- Are the significant source of revenue
- Offers Customer Lifetime Value (CLV) for the business
Why use it: Profitability report is an essential CRM report for B2B companies who use account-based marketing to generate revenue.
-
Sales Forecast Reports
Having a clear picture of the sales pipeline will let a business project its future revenue. They can also use the past sales trends and current lead opportunities for the sales forecast.
Why use it: Sales forecast reports will help you make your predictions reliable. This CRM report showcases the accurate sales pipeline.
Many businesses believe that their pipelines are accurate but still spend many hours a week creating future predictions on sales metrics.
-
Email Outcomes CRM Report
The goal of Email Outcomes Reports is to know the effectiveness of emails.
Why use it: It lets you track the number of emails sent and replied to, as well as those emails that haven’t been responded to by customers.
-
Visit Outcomes CRM Report
Visit Outcomes report shows insights on how effective the customer visits are in your business.
Why use it: It will let you sort out interested, not interested, come back later, and no answer. You can use this CRM report to identify the best times to visit the potential leads.
How to Increase CRM Numbers in Your Favor?

There is no single way to boost sales CRM numbers. But we, at The Cloud Tutorial (TCT), can help your business go the extra mile in delivering good customer service by offering CRM reporting that takes you in the right direction. Here’s how we can do that.
- We will help you create Omni channels and share data regarding a customer’s behavior and purchase history with your sales reps.
- We will help your team provide personalized services, such as special deals based on what a customer has purchased in the past.
- The Cloud Tutorial (TCT) will also help you build self-help materials like structured FAQs and YouTube tutorials for your customers.
- We will help your customers find solutions to their queries.
- Ultimately, all this will boost the CRM numbers for your business.
Visit our website to know more about us, our features, our services, and pricing.
FAQs
Conclusion
When looking for a CRM report, determine what your team needs the most. If you want to create a data-driven CRM report, deliver insightful services, and organize customer-centric processes, then CRM reporting tools will help you move in that direction.
Take time to figure out which CRM reporting tools are best for your business, whether you want to create a sales conversion report, revenue performance report, or profitability reports.
Think that The Cloud Tutorial (TCT) is the right platform for saving all your CRM reports? Visit our website and schedule a free trial today.
Try it out before you decide.
Create a test article NOW!


Using this tool, all you have to do is add your first test article and see how it looks. Now, you don’t have to sign-up or login into CloudTutorial software just to check how your first article appears.